February 15, 2019
Elbert Capital Management Q1 2019 Letter
At Elbert Capital Management, I spend a lot of time thinking about what drives financial asset returns. I believe that financial asset returns in the long-term are largely determined by valuations, while returns in the short-term are largely determined by investor sentiment and investor’s willingness to speculation.
In this letter we will explore two well documented market valuation metrics that have a high correlation to long-term equity market investment returns. We’ll take a look at the Equity Market Cap-to-GDP ratio and also the Cyclically Adjusted Price-to-Earnings Ratio (CAPE). This CAPE is also frequently referred to as the Schiller PE after Nobel Laureate Robert Schiller who developed the metric.
Market Cap-to-GDP
The market cap-to-GDP ratio looks at the ratio of United States corporate equity values to the nominal GDP of the United States. For the market cap values I use the Federal Reserve’s metric of Non-Financial Corporate Equities. You may also see other metrics such as the Wilshire 5000 index used with similar results. We divide the market cap number by nominal GDP to get the ratio.
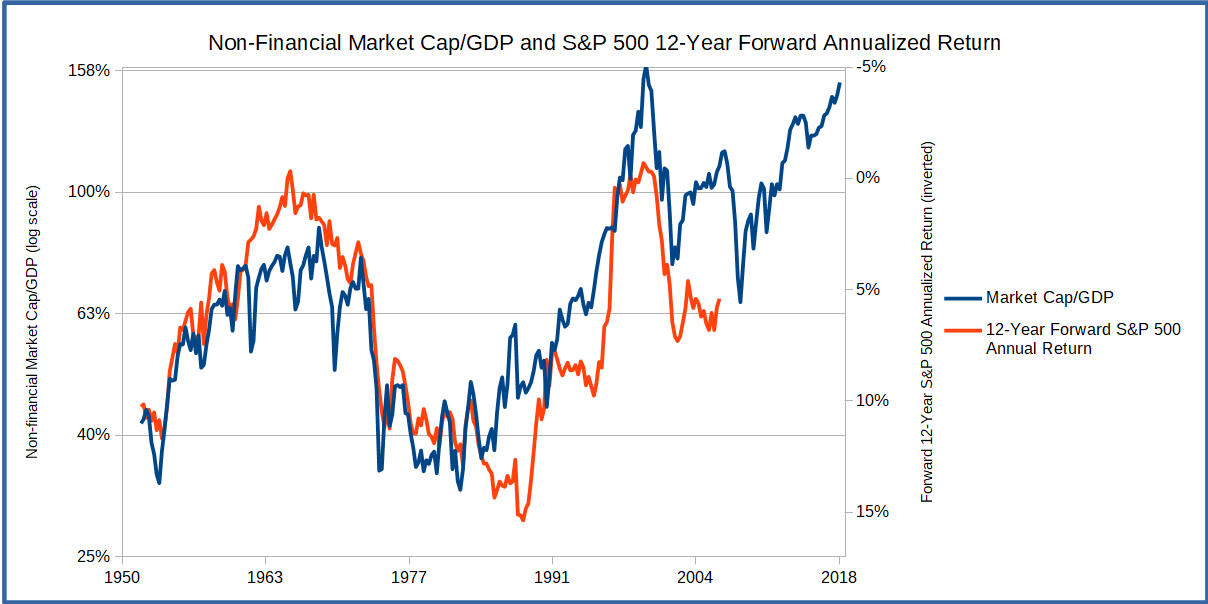
We can plot the ratio and compare it to the S&P 500’s forward returns for a specified period of time (we’ll use 12 years in this analysis). The graph below plots these two series. The market cap/GDP is presented in logarithmic scale and the S&P 500 returns are presented inverted. As we’ll see, the relationship is an inverse logarithmic one.
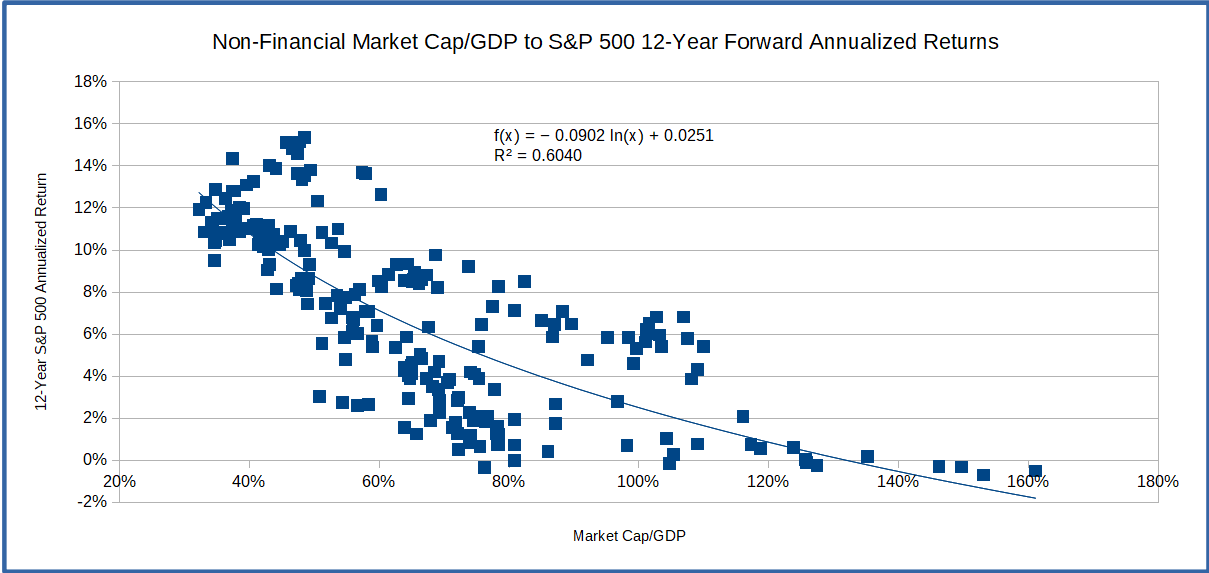
We can next generate a scatter plot of the relationship between the market cap/GDP ratio and the forward 12-year returns. As mentioned, the relationship appears to be negative and logarithmic. The R2 value of 0.6040 effectively means that 60% of the forward 12-year S&P 500 return can be explained by the market cap/GDP ratio.
Cyclically Adjusted Price-to-Earnings
We can conduct a similar analysis with the Cyclically Adjusted Price-to-Earning ratio (CAPE).
A few notes on the CAPE first. At a high level, the CAPE takes the average of the prior 10 years of inflation adjusted earnings. We divide the current asset price by the average earnings number we calculated. Here we’ll be looking at the CAPE for the S&P 500 but the CAPE can be calculated for any equity index or individual equity security. The reason the CAPE uses 10 years of earnings is to try to account for the cyclical nature of earnings through out the business cycle. One interesting note is that the current economic cycle is the longest in recent history and may breach the CAPE’s 10-year horizon (S&P 500 earnings bottomed in March 2009 in the previous business cycle low). Investors may have to look to extend the time period in order to capture the entire business cycle.
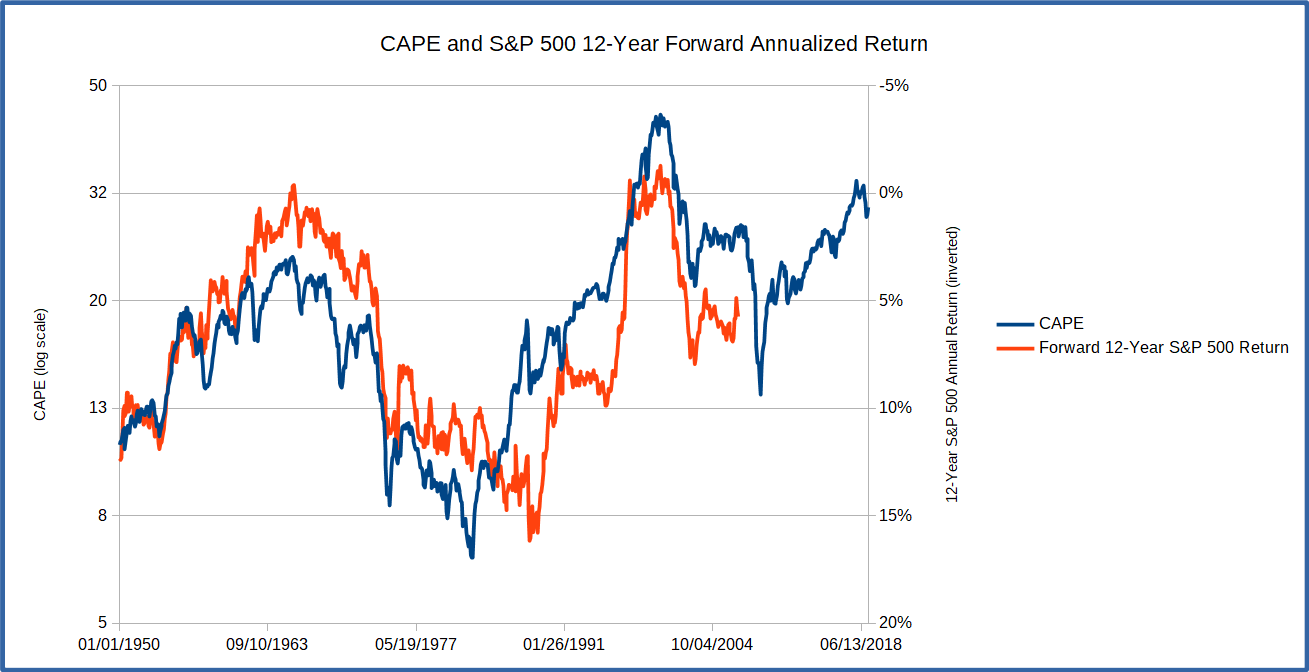
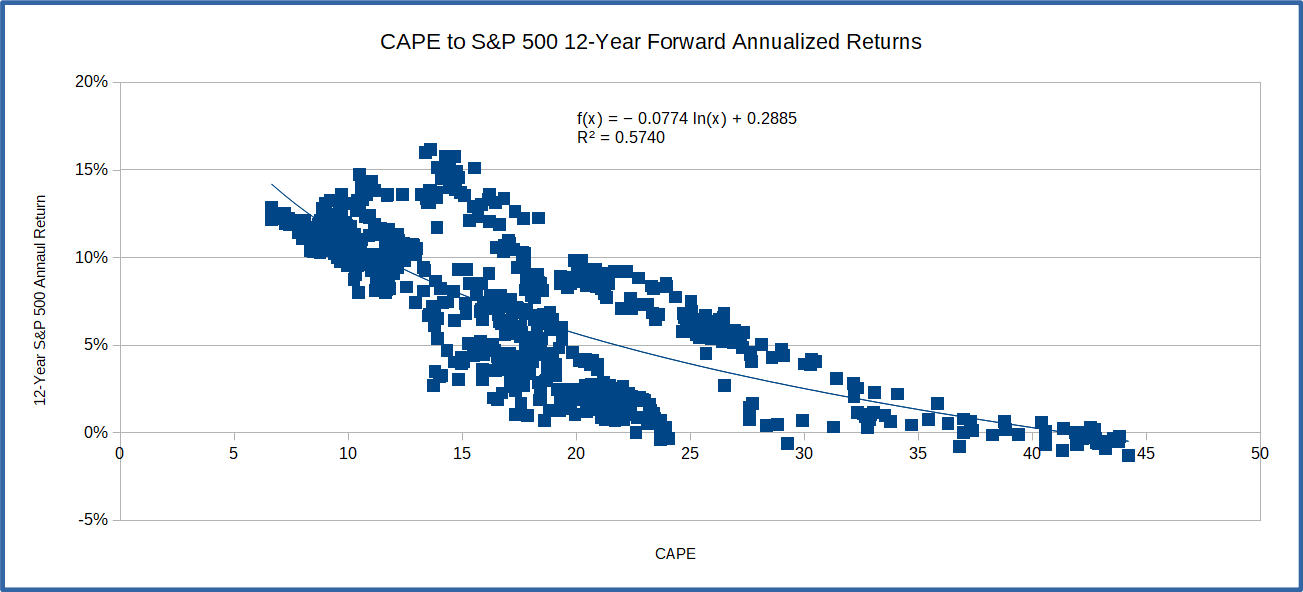
Below are similar graphs for the CAPE as we generated for the market cap/GDP ratio above. We see that the CAPE also exhibits a negative logarithmic relationship to the S&P 500 forward returns. Here we have a decent R2 of 0.5740.
Combined Model
What if we combine these two metrics together to generate a model that explores the relationship between these two metrics and the S&P 500 forward return? We can produce a multiple regression and see if it offers any predictive usefulness.
The below two graphs show the predictions of the multiple regression. As we see, it is not a perfect relationship but does describe about 60% (R2 of 0.6062) of the S&P 500’s forward 12-year annualized return.

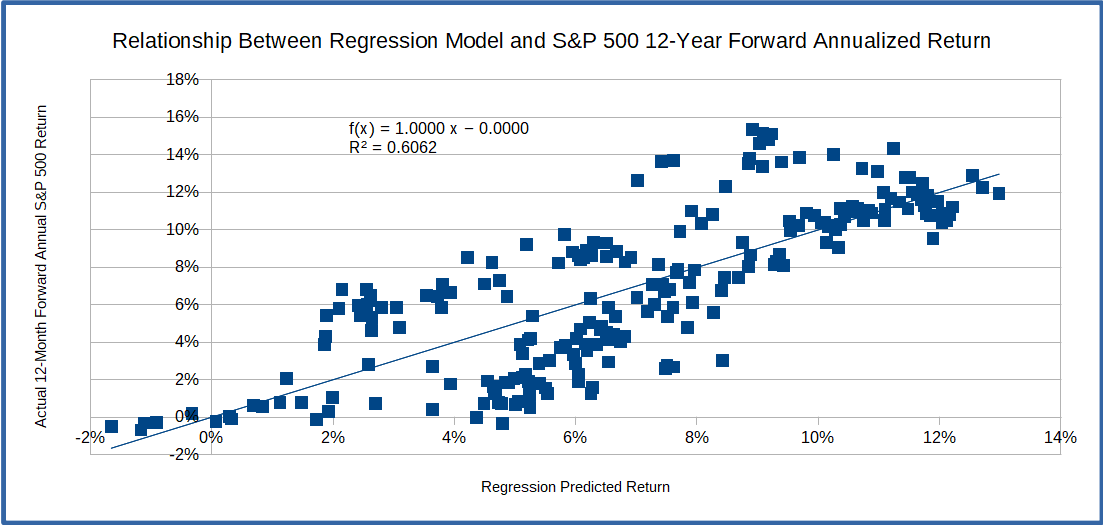
Of more applicable interest, the regression is currently predicting an annualized 12-year forward return of about -0.69%. As mentioned, the regression is far from perfect but does indicate that investors may want to proceed with caution in the equity markets.
Some quick thoughts on predictions. I don’t try to predict the direction of the market or the return of the market over the short-term. Most of the analysis I do, including the above, is in an attempt to determine if the investment environment, in a particular asset or asset class, is attractive and offers potentially attractive risk adjusted returns. When the model above predicts a -0.69% return, I don’t think of this number as an actual prediction of the future return (there is almost absolute certainly that the forward annualized 12-year return of the S&P 500 will not be -0.69%). I use it as a proxy for the attractiveness of the equity investment environment. The indication from the regression is that now is an unattractive time to purchase equities similar to before the dot-com crash of 2000.
Final Thoughts
Based on the market cap/GDP ratio, the CAPE, and other metrics we follow, we believe the US equity markets present significant risks relative to potential returns. With equity valuations at historically high levels (as shown by the market cap/GDP and CAPE) it is unlikely that investors will be sufficiently compensated for taking equity risk. Elbert Capital continues to position client portfolios with these risks in mind.
This is not an investment recommendation or a solicitation to become a client of Elbert Capital Management LLC. Elbert Capital Management LLC is a Fee Only, Registered Investment Adviser firm. Advisory services are only offered to clients or prospective clients where Elbert Capital Management LLC and its representatives are properly licensed or exempt from licensure. This letter is solely for informational purposes. Past performance is no guarantee of future returns. Investing involves risk and possible loss of principal capital. No advice may be rendered by Elbert Capital Management LLC unless a client service agreement is in place.